

 Enquire
 Call
Call
 chat
chat
 Search
Insight Brief: Baselining Embodied Carbon in Building Sector - A Comparative Study Across Building Heights
By dr. prasad marepalli, aun abdullah - lodha
October 08, 2025Preface
As India urbanizes at a pace unmatched in history, the choices we make today will shape the carbon profile of our cities for decades. Operational emissions are beginning to fall as the grid shifts to cleaner sources, but embodied carbon remains stubbornly high. These emissions are released before a building even opens, are irreversible once construction is complete, and are tied majorly to cement and steel at the core of India’s growth story.
Decarbonization in India cannot follow a Western script because our energy economy, scale, resources, and construction practices are different. India’s net-zero path must focus on the responsible growth of the median segment, comprising mid-market residential and commercial developments. Embodied carbon is generally treated as a side note in sustainability debates, often reduced to Scope 3 disclosure checklists or imported benchmarks that do not reflect India’s realities. What is needed is a grounded baseline that captures the specifics of Indian construction, industry, supply chains, and materials to guide practical and effective emission reduction strategies.
This study is an attempt to fill that gap. By benchmarking embodied carbon across building heights and typologies, it offers a clearer view of where emissions come from, how design efficiency can reduce them, and what role materials and processes must play in further reductions. The purpose is not only to establish numbers but to enable decisions: for architects and engineers to design with carbon awareness, for industry to prioritize disclosures and innovation, and for policymakers to craft frameworks that reward reductions. This work is a step towards that vision.
Contents
4. Embodied carbon assessment for various buildings
5. Potential of material substitution and energy transition
6. Recommendations for stakeholders
1. Introduction
Embodied carbon, the emissions locked into a building before it is put into service, can account for 30-50% of its total lifecycle emissions. These are the upfront emissions from raw material extraction through manufacturing and transport, defined in this study as A1 to A3. Once construction ends, these emissions are fixed. They cannot be retrofitted out and are often tied to hard to abate materials such as cement and steel.
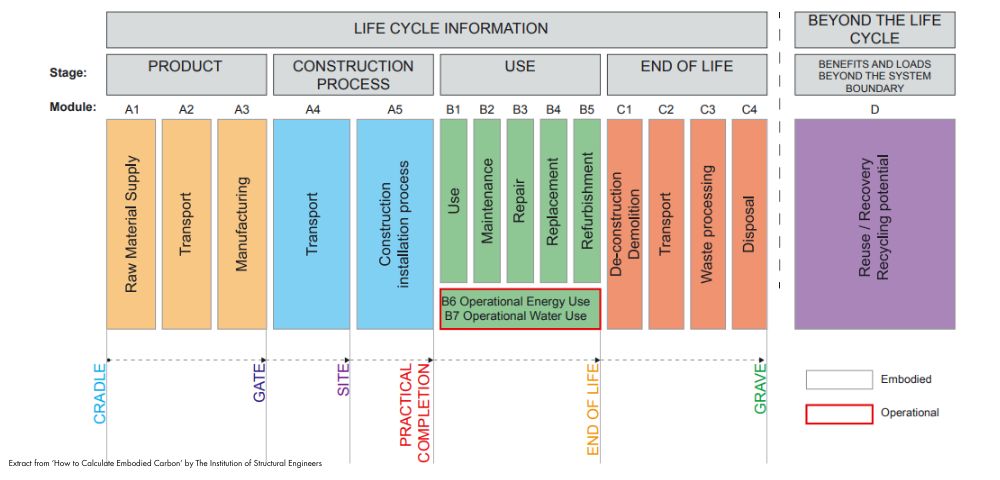
Figure 1: Lifecycle stages and modules, by IStructE1
With India’s electricity grid steadily decarbonizing, operational emissions are on a long term decline, while embodied emissions remain unchanged unless addressed at the design and construction stage. Reducing embodied emissions is therefore urgent and achievable through material efficiency, strategic substitution, and, above all, careful engineering and design. This study contextualizes material emissions for India, focusing on the median segment, and establishes baselines that highlight how design and material choices can drive steady decarbonization in the building sector, as outlined below.
a. Need for baselining
Without a baseline, embodied carbon conversations risk being abstract and speculative. Baselining allows for comparability, target-setting, and the identification of priority areas for intervention. Establishing median values for different building types, material intensities, and processes in India provides the grounding for collective progress.
EC for compliance or reduction: The framing of embodied carbon in India is still evolving. Should it be treated as a compliance metric, reduced to a disclosure exercise based on out-of-context databases? Or should the focus be on driving actual reductions, encouraging innovation, and enabling substitution? Both approaches have merit, but sequencing is critical. Mandating compliance without providing tools, reliable data, and supply-side readiness risks creating bureaucratic burden with little real impact.
How to prioritize action: What is needed now is estimation grounded in the best available local data, rather than reliance on generic global references. Once priority materials and approximate emission intensities are clear, stakeholders—including policymakers generate accurate industry data, build awareness, and drive the policy changes required across the supply chain.
Help in awareness and collective action: Embodied carbon remains a technical subject. Translating it into actionable insights for designers, developers, policymakers, and the public requires sustained communication. Comparative assessments, such as the one in this paper, help build awareness by showing both the scale of impact and the range of possible interventions.
b. Material related emissions in Indian Context
Environmental Product Declarations (EPDs) are a global standard for measuring several environmental indicators, including embodied carbon, at the product level. In India, however, the presence of verified EPDs is still sparse and uneven. While some cement producers have begun publishing EPDs, many steel producers, especially those in the recycled route through induction furnaces, do not. Things are changing nonetheless, with a new green steel taxonomy in place, organisations have started to get their emissions certified by agencies designated by the ministry of steel. EPDs have started to become available in some other critical product categories but not all.
The lack of coverage across critical product categories limits precision in embodied carbon calculations. In such cases, proxy values and international databases are often used, but they fail to capture the local energy mix, process efficiencies, or raw material sourcing typical to the India context.
c. Importance of Median Segment
Most discussions on embodied carbon focus either on high-performance niche projects or on aspirational global benchmarks. The median segment—the large volume of mid-market residential and commercial buildings that define India’s urban growth—receives far less attention. Yet, it is this segment that will ultimately determine the trajectory of national emissions. Understanding material baselines and efficient design templates for this median segment is essential for meaningful impact.
In this study, we present embodied carbon baselines for reinforced concrete apartment buildings ranging from around 10 to over 40 storeys, along with one 40 storey composite office building. Using the same template as our earlier baselining work2, we illustrate how building scale, material intensity, and engineering choices shape carbon outcomes. This dataset expands the limited published evidence from India and is intended to help practitioners and policymakers identify high-impact levers for reducing embodied carbon in the median segment of the urban built environment, which is driving much of the country’s rapid growth. With greater awareness, supply-chain buy-in, and enabling policy frameworks, the current data gaps on embodied carbon can be bridged more quickly. The study is designed to help the ecosystem focus on the materials and decisions that matter most, rather than expending effort on marginal details while missing opportunities for urgent and decisive action.
2. Baselining
We developed a template for realistic estimation of embodied carbon at the building level, published in mid-2022, which has since received wide attention across the industry and beyond. This involved defining a standard range of materials for median segment buildings, material quantities are derived from detailed bills of quantities across multiple contracts, and applying emission coefficients derived from EPDs or estimated values. Where EPDs are absent, we apply reasoned assumptions based on process energy intensity and industry averages.
This exercise allowed us to identify the materials with the highest emissions and establish priority areas for our decarbonization roadmap. The materials contributing most to embodied carbon are cement, concrete, steel reinforcement, structural steel, aluminum, lightweight blocks, glass, paint and tiles.
During this process, we encountered significant data gaps in the supply chain and adapted our approach to work around them. The lack of verified Environmental Product Declarations (EPDs) for many materials, coupled with the absence of tools tailored to the Indian context, creates uncertainty. Relying solely on generic international databases would produce estimates that fail to reflect local production processes, fuel mixes, and supply chains, reducing the exercise to mere disclosure compliance rather than identifying where meaningful reductions can be achieved. To address this, we have used the best available local data, supplemented with supply chain insights, and estimated coefficients where official values were missing, as explained below.
Where EPDs are not available, we have broken down materials into their constituent components, considered emissions at each stage of the supply chain, and reassembled them into composite coefficients. This has required careful balancing of published data, supplier inputs, and contextual adjustments.
Concrete serves as a good example. Our methodology allows coefficients to reflect both the material composition and the operational realities of sourcing and transportation. For different mixes, we derived embodied carbon coefficients by considering the major constituents, as follows:
| Material | Type / Example | Embodied Carbon Coefficient (kg CO2e/kg) | Notes |
|---|---|---|---|
| Cement | OPC (Ordinary Portland Cement) | 0.996 | Reference EPD7 |
| PPC (Portland Pozzolana Cement) | 0.71 | Reference EPD7 | |
| Supplementary Cementitious Materials (SCMs) | Ground Granulated Blast Furnace Slag (GGBS) | 0.069 | Reference EPD8 |
| Microfine GGBS | 0.108 | Reference EPD9 | |
| Dry Fly Ash | 0.065 | Reference EPD10 | |
| Gypsum | Gyproc Elite 100 | 0.17–0.18 | Approximate range |
| Gyproc Xpert+ | 0.16–0.17 | Approximate range | |
| Aggregates | 10/20 mm Recycled Concrete Aggregate | 0.005–0.01 | Approximate range |
| Admixtures | Based on vendor inputs | – | Coefficients vary by supplier |
| Transport | Project-specific | – | Captured at actuals for each project |
Table 1: Example material - Concrete
Similarly, for aluminum, we have adopted a similar breakdown approach. Emissions are estimated by considering four key stages of the supply chain—processing of ore, extrusion, assembly into window systems, and installation. The aggregate embodied carbon value from this chain is ~25 kg CO2e/kg (Processing: 18kgCO2e/kg + Extrusion ~5kgCO2e/kg + ~1kgCO2e/sqm each at the assembly and installation stages), reflecting both material processing and end-use integration. In our original exercise2 we included formwork-related emissions, but have now excluded them in line with an updated boundary that classifies formwork as a capital good rather than a building material.
Our study seeks to bridge this gap by developing coefficients that are directionally sound, locally grounded, and explicit about their assumptions. By documenting both our methodology and the ranges involved, we aim to strengthen the foundation for more robust, context-specific tools in India. Until such tools are in place, the focus must remain on reductions where they matter most, rather than chasing absolute precision in areas of marginal impact.
During this baselining exercise, it became clear that existing embodied carbon tools fall short in capturing the realities of Indian construction.
Most available tools and databases are either aligned with Western supply chains or rely on generic datasets that overlook critical local factors—such as the dominance of induction furnace steelmaking, variable clinker factors in cement, and the widespread use of blended cements. This leaves a methodological grey area where accuracy is limited, yet practitioners still need to make decisions. Our template is a framework that can be adapted and refined for wider application and for easier implementation in practice.
3. Net Zero by Design
In our earlier paper3, we had demonstrated that resource efficiency driven elegant solutions are the cornerstone of performance and sustainability. Decarbonizing construction rests on three interdependent and overlapping layers of transformation:
- Material Minimalism - The most immediate, cost-effective, and high-impact layer, reducing material use through sustainable design thinking. This layer can be addressed rapidly, delivering quick and substantial reductions in embodied carbon.
- Low Carbon Technologies - A crucial but gradual process shaped by regulatory and supply chain constraints, safety considerations, and economic realities. This includes innovations such as low-emission concrete and steel, as well as recycled materials. Gains in this layer will materialize over time.
- Clean Energy Transition - System-wide emission reductions across material production through cleaner energy sources such as renewables, hydrogen, carbon capture utilization and storage (CCUS), and electrification. Some portions of this layer can be leveraged quickly, but widespread transformation will take time.
For deep carbon reduction, these layers must be tackled in the right sequence. The first and third layers offer immediate opportunities that must be fully leveraged, ensuring that progress in the middle layer—though gradual—is significant enough to drive meaningful change. If material minimalism and clean energy shifts are not maximized early, the slow gains from low-carbon technologies alone will fall short of the necessary impact.
The philosophy is rooted in the belief that the cleanest tonne of carbon is the one never emitted. This requires front-loading effort into design decisions that reduce material use before considering substitutions or technologies. Direct load paths to foundations, minimizing flexure in structural systems, achieving regular geometries and symmetry, and designing for durability are the primary levers. These principles ensure that structures carry forces efficiently, minimize redundancies, and deliver a longer maintenance-free service life.
By sequencing design efficiency before material substitution, we can avoid the common pitfall of treating embodied carbon as merely a matter of swapping one product for another. Materials then become the final lever: once the design itself has been optimized, low-carbon options like blended cements, recycled steel, or fly-ash blocks can be applied to capture further reductions. By design, this approach establishes a comparatively low baseline of ~350–550 kg CO2e/m² in several categories of the median-segment.
The design-first approach discussed in this paper contrasts sharply with prevailing industry practice, where embodied carbon is often addressed through product databases or compliance checklists. Such methods risk generating studies focused solely on disclosure, rather than meaningful reductions—particularly in contexts where local EPDs are limited and international tools fail to capture Indian realities.
By prioritizing geometry, structure, and durability first, and then integrating material substitution and energy transition, this framework provides a blueprint for addressing embodied carbon in the built environment. It establishes a clear baseline, highlights opportunities for further reductions, and provides an actionable model for stakeholders driving India’s urban growth, offering a pathway that other developing economies can adapt to their own conditions. The study also sheds light on additional reductions achievable through material substitutions, opportunities that go beyond current business-as-usual practices in the industry, as explored in the subsequent sections of this paper.
4. Embodied carbon assessment for various buildings
This study examines a set of buildings spanning different typologies and heights, chosen to reflect India’s rapidly growing median segment. It is within this segment that most of the built environment expansion will occur in the coming decades, consisting of higher-density developments concentrated in economically expanding urban centers. The selected projects therefore go beyond isolated case studies; they represent the mainstream trajectory of India’s urban growth.
The inclusion of these projects was guided by two key considerations. First, to generate a diverse range of data points across building types and scales. Second, to ensure sufficient representativeness of the dominant construction material in India—reinforced cement concrete. Framing the study around these parameters enables us to capture not only what is technically feasible, but also what is practical, relevant, and scalable for India’s urban future.
| Building Reference | Configuration | Building Height m | Built-up Area sqm | Building EC KgCO2e/sqm (Click link) |
|---|---|---|---|---|
| B01-32m-8026sqm | G+10 | 32 | 8026 | 352 |
| B02-44m-16989sqm | G+14 | 44 | 16989 | 394 |
| B03-56m-15984sqm | G+18 | 56 | 15984 | 391 |
| B04-70m-10424sqm | G+23 | 70 | 10424 | 444 |
| B05-70m-10490sqm | G+23 | 70 | 10490 | 376 |
| B06-121m-32150sqm | G+35 | 121 | 32150 | 477 |
| B07-122m-34617sqm | G+39 | 122 | 34617 | 528 |
| B08-123m-43965sqm | G+40 | 123 | 43965 | 518 |
| B09-130m-29091sqm | G+40 | 130 | 29091 | 502 |
| B10-136m-127830sqm | 2B+G+40 | 136 | 127830 | 567 |
Table 2: EC across building heights
Notes:
- B01 to B09 are multi-family residential RCC buildings
- B05 is a RCC building with triple blend concrete mix, with clinker factor ~0.5
- Embodied carbon for B06, B07 and B08, despite similar heights, varies due to the differences in framing and the quantity of blockwork.
- B10 is a hybrid building featuring a concrete core, composite decks supported on steel beams, and composite columns. The structural steel sourced for this building is imported which carries 40% lower embodied carbon coefficient compared to locally available.
- For raft or isolated footings on grade, typical foundation depths range between 2.5 m and 3.0 m. For pile foundations, the material consumption of piles is excluded.
- The EC footprint reported above is based on Construction Built-up Area (BUA), which differs from Architectural BUA. While Architectural BUA focuses on usable architectural space through selective inclusions and adjustments, Construction BUA accounts for the complete physical structure. In EC analysis, these terms are often used interchangeably. However, for consistency, we propose using Construction Built-up Area as the standard reference. Since it includes all elements at their actual built dimensions, it provides a more accurate basis for assessing material consumption and embodied carbon.
It is also observed that concrete, steel and aluminium together account for over two-thirds of embodied emissions in most cases. The general share of key materials is depicted in the graph below.
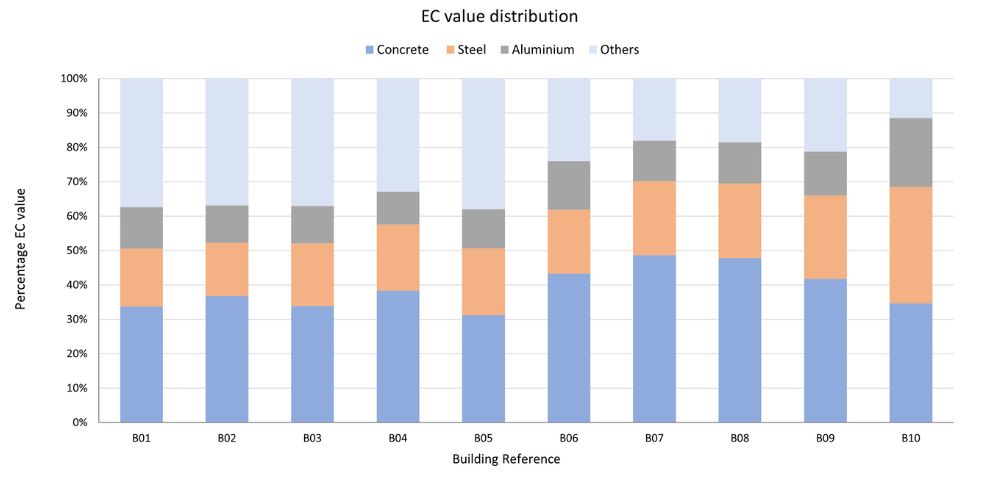
Figure 2: Percentage of EC attributed to concrete, steel and aluminium
The primary aim of this exercise is to establish a consistent template and framework that can be progressively refined as more accurate data becomes available from the supply chain. The data presented here represent the best available estimates, but due to the lack of verified EPDs for many categories, the results should be interpreted as indicative rather than definitive.
The data presented here provides actionable insights for designers, manufacturers, and policymakers to target reductions effectively within their respective domains. Meaningful impact can only be achieved through coordinated efforts across all stakeholders, as individual actions in design, material substitution, or energy transition alone are insufficient. By consolidating potential savings, this work can guide the development of a sectoral roadmap for the built environment aligned with the national net-zero strategy.
5. Potential of material substitution and energy transition
Pathways to material-related emission reduction can be broadly grouped into three categories, as follows:
- Substitution: This includes the use of blended cements, higher usage of supplementary cementitious materials in concrete, steel recycling combined with higher usage of renewable energy, recycled aluminium, etc.. These measures directly reduce demand for virgin, carbon-intensive inputs while creating opportunities for circularity within the construction value chain.
- Process improvements: Efficiency gains through heat recovery, process optimization, and upgrades to kilns and induction furnaces can significantly reduce emission intensities during material production. These measures focus on improving existing processes to maximize environmental benefits without requiring radical changes to the material supply chain.
- Energy transition: The use of alternative fuels and the electrification of material processing upstream, combined with carbon capture downstream, can substantially reduce the carbon footprint of core construction materials over the long term. This approach supports deep decarbonization by addressing both the energy inputs and the emissions released during production.
Together, these three pathways provide a practical roadmap for near- and mid-term reductions while keeping sight of deeper decarbonization opportunities in the construction sector.
Short-term opportunities exist in the broader adoption of already proven substitutes that are available in the market. Ready-mix concrete suppliers can proactively offer mixes with higher proportions of supplementary cementitious materials such as fly ash or GGBS, while maintaining performance and quality. Likewise, steel4,5 and aluminum producers should increase the recycled content in their inputs and disclose the associated embodied carbon intensities. Transparent reporting can help develop a market for low-carbon products and build wider confidence across the construction industry.
Building on the analysis presented and aligned with current industry and research trends, we project potential reductions in embodied carbon for buildings in the medium term (2030) and long term (2035), focusing on three key materials, as outlined below:
| Material | Medium term (2030) | Long term (2035) |
|---|---|---|
| Concrete | Reducing the clinker factor to 0.5 | Reducing the clinker factor to 0.3 |
| Steel | Increasing recycled inputs and renewable electricity to achieve emissions below 1kgCO2e/kg | Increasing recycled inputs and renewable electricity to achieve emissions below 0.5kgCO2e/kg11 |
| Aluminium | Higher use of recycled content to achieve emissions below 15kgCO2e/kg | Higher use of recycled content to achieve emissions below 5kgCO2e/kg12 |
Table 3: Projection of EC intensities
The embodied carbon of the buildings presented in Table 2 is projected to evolve under the scenarios described above. For this set of residential buildings, the range can decline from 350–550 kg CO2e/m² to 250–375 kg CO2e/m² in the medium term and 200–300 kg CO2e/m² in the long term. This approach demonstrates how RCC buildings of similar typologies may perform under different levels of technological readiness, market adoption, and policy support, providing a forward-looking view of the opportunities ahead.
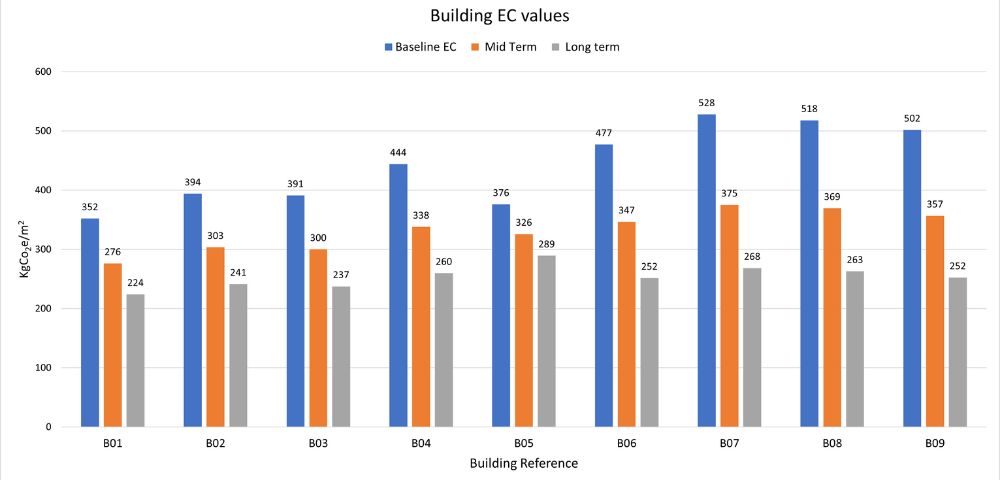
Figure 3: EC values comparison Baseline vs Projections
Achieving this progression requires action on two fronts. First, industry roadmaps from major manufacturers and sectoral bodies provide guidance on technological shifts, but these disparate roadmaps must be aligned with sectoral strategies and the national net-zero roadmap. Second, demand-side actors need to shape procurement specifications that actively reward low-carbon production and engage with the fastest-decarbonising supply chain partners. Bulk buyers and government agencies play a critical role by forming buyers’ coalitions and leveraging public procurement at scale. Together, these measures can help ensure that the industry delivers on its decarbonization potential in line with national priorities.
6. Recommendations for stakeholders
This baselining study shows that reducing embodied carbon is possible, but it requires coordinated and deliberate action from every actor in the building ecosystem.
Design Professionals
The responsibility to reduce embodied carbon begins at the drawing board. Architects and engineers should embed carbon considerations early in the design process by keeping the designs simple, establishing clear load paths, maintaining symmetry in the structural systems, and designing for durability. Insisting on transparent material disclosures during procurement and applying life-cycle thinking ensures that buildings deliver both performance and efficiency across their lifespan.
Industry
Manufacturers, suppliers, and developers must move beyond incremental improvements. Publishing Environmental Product Declarations (EPDs), investing in low-carbon technologies, and adopting circular practices across supply chains are critical steps. Just as important is procurement: industry must actively source and specify low-carbon products, setting clear benchmarks for what constitutes acceptable embodied carbon in construction. This will help shift the market toward rapid adoption of proven low-carbon solutions.
Policy Makers
Government and regulatory bodies set the framework within which change occurs. They must establish robust baselines, integrate net zero provisions into building codes, and provide targeted incentives for low-carbon production and efficient building designs. Public procurement at scale can create demand certainty, accelerating investment and adoption across material supply chains.
Academia
Research institutions must address persistent data gaps through independent measurement, rigorous material testing, and the creation of India-specific embodied carbon coefficients. Equally important is the development of tools calibrated to Indian conditions so that compliance drives real reductions rather than becoming a bureaucratic burden. Academia and institutions should actively collaborate in designing these tools, ensuring they are practical, transparent, and widely adoptable.
Market and Public Awareness
Decarbonization cannot succeed without demand. Awareness must extend beyond operational energy savings to the full climate footprint of buildings. Buyers’ coalitions, financing mechanisms that reward low-carbon projects, and consumer education can align market forces with decarbonization. Public procurement, when tied to embodied carbon thresholds, can act as the strongest market signal, creating momentum for widespread adoption.
By acting in concert, these stakeholders can transform embodied carbon from a peripheral concern into a central metric of building performance. The coordinated effort will be essential for aligning India’s building sector with national net-zero goals.
7. Conclusions
This study establishes a grounded baseline for embodied carbon in India’s building sector, with a focus on the median segment of residential and commercial developments that will shape the country’s urban trajectory. By examining a range of reinforced concrete buildings across different heights and typologies, it highlights both the scale of current emissions and the opportunities available for reduction through design efficiency, material substitution, process improvements, and clean energy transition.
The study demonstrates that design decisions must precede material substitution if reductions are to be both substantial and cost-effective. When combined with low-carbon products and system-wide energy transition, this design-first approach provides a blueprint for deep and sustained decarbonization.
The findings show that embodied carbon in median-segment buildings typically ranges between 350–550 kg CO2e/m² today, but can decline to 275–375 kg CO2e/m² by 2030 and 225–300 kg CO2e/m² by 2035 under plausible pathways of technological readiness, market adoption, and policy support. Cement, concrete, and steel emerge as the dominant contributors, underscoring the importance of targeted action in these materials.
By establishing baselines contextualized to India and projecting credible pathways for reduction, this work provides the building blocks for a sectoral roadmap that is both practical and ambitious.
8. Acknowledgement
We gratefully acknowledge the contributions of Dr. Lav Singh and Mr. Jai Thakkar, whose expertise was instrumental in developing the embodied carbon templates, deriving embodied carbon coefficients, establishing material quantities and creating the scenarios and analyses that underpin this study. Their work has been central to shaping the methodology and insights presented here.
9. References
1. A Brief Guide to Calculating Embodied Carbon — Institution of Structural Engineers (IStructE)
https://www.istructe.org/IStructE/media/Public/TSE-Archive/2020/A-brief-guide-to-calculating-embodied-carbon.pdf
2. Embodied Carbon in High-Rise Buildings: Insights from a Baselining Study — Lodha Group
https://www.lodhagroup.com/blogs/sustainability/embodied-carbon-in-high-rise-buildings-insights-from-a-baselining-study
3. Net Zero by Design – Material Minimalism First, Technology & Transition Next — Lodha Group
https://www.lodhagroup.com/blogs/sustainability/net-zero-by-design-material-minimalism-first-technology-transition-next
4. Greening the Steel Sector in India: Roadmap and Action Plan — Ministry of Steel, Government of India
https://steel.gov.in/sites/default/files/2025-03/GSI%20Report.pdf
5. The Rebar Opportunity: Decarbonising the Backbone of India’s Construction — Lodha Group
https://www.lodhagroup.com/blogs/sustainability/rebar-opportunity-decarbonising-backbone-of-india-construction
6. Vision Document on Aluminim Sector 2025 - Ministry of Mines
https://mines.gov.in/admin/download/686b72a13ed1e1751872161.pdf
7. Environmental Product Declaration of Cement Products (OPC, PPC, PSC, PCC) — UltraTech Cement Ltd. (Author: Dr. Rajesh Kumar Singh, Thinkstep Sustainability Solutions Pvt. Ltd., a Sphera Company; Programme: International EPD® System)
https://api.environdec.com/api/v1/EPDLibrary/Files/f23f7e4e-486b-4dd4-acff-08da599e304a/Data
8. Environmental Product Declaration — (EPD file: e97d43ed-67ba-4335-d7d4-08dd87c03f38, source: International EPD® System)
https://api.environdec.com/api/v1/EPDLibrary/Files/e97d43ed-67ba-4335-d7d4-08dd87c03f38/Data
9. Environmental Product Declaration — (EPD file: 6d843baa-19cb-4505-c456-08dd893621d8, source: International EPD® System)
https://api.environdec.com/api/v1/EPDLibrary/Files/6d843baa-19cb-4505-c456-08dd893621d8/Data
10. Environmental Product Declaration — (EPD file: d377360f-c2b0-46ec-9f40-08ddba9df9a6, source: International EPD® System)
https://api.environdec.com/api/v1/EPDLibrary/Files/d377360f-c2b0-46ec-9f40-08ddba9df9a6/Data
11. Steel GHG Emissions Reporting Guidance — Rocky Mountain Institute (RMI)
https://rmi.org/wp-content/uploads/2022/09/steel_emissions_reporting_guidance.pdf
12. Restora – Low-Carbon Aluminium — Vedanta Aluminium
https://vedantaaluminium.com/products/restora-low-carbon-aluminium/
You may also like
 Lodha Foundation & Sustainability
 Lodha Foundation & Sustainability
 Lodha Foundation & Sustainability
Recent Blogs
 Recognitions & Milestones
 Lodha Foundation & Sustainability
 Recognitions & Milestones
